Like most websites, 30MHz uses cookies to remember you so that we can deliver an optimised browsing experience. Select ‘Accept all’ if you’re okay with accepting cookies from UserEngage (webchat and lead generation), Hotjar (website improvement) and LinkedIn (tailored ads). When you select ‘Accept only necessary’, we will place cookies that let you use our website properly by remembering your preferences and for anonymous statistics. For more information, please see our cookie policy and privacy notice.

Accept all
Accept only necessary

The data platform for horticulture

Collaborative, interactive allround crop insights

Our data platform is the central point of 30MHz. This software connects sensors, growers, consultants and every other person or organisation concerned. The data platform is easy to use and enables everyone to create charts, tables and other visuals. It’s entirely up to you to decide which data you want to see: temperature, weather forecasts, dew point, etc. This means that you can create your own customised dashboard to obtain a clear picture of what is happening in your greenhouse.

Digital Connect provides you with the digital tools to create a database filled with meaningful and adequate data describing the status of climate and crop. You will be able to control and optimise growth and production plans in one digital platform.

Download the Digital Connect brochure

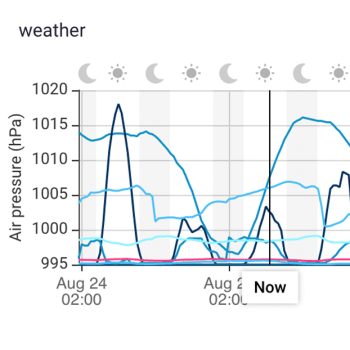
Weather data

Weather data can be considered the backbone of the 30MHz dashboard.
Use the weather data in many ways

Notifications and alerts

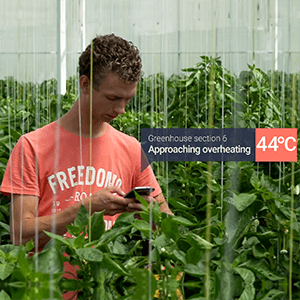
Set up custom notifications when sensor values cross certain thresholds, get alerts on uptime and connectivity, and stay up to date on each device’s battery life in real-time with alerts via email or sms.
More on 30MHz data platform notifications
Growing Degree Units

Growing degree days (GDD) are used to estimate heat accumulation and predict the development of plants and pests. An even more accurate measure is growing degree hours (GDH), where on an hourly basis the average temperature is used to calculate the growing degrees.
Keep up with the conversation

Social feed

Stay up to date on your colleague’s work, share knowledge and create an interactive record of your past crop strategy with a feed of comments and images.
Stay up to date

Visual comments

Dive into your live and historical data to flag anomalies, keep notes, add pictures or ask questions of colleagues. Keep the dialogue in a central platform where data is easily shared and exported, but you’re the sole proprietor.
Get the picture

Manual data input

With the manual input feature, we make it easy to bring data collected the low-tech way straight into the 30MHz data platform, and interact with that data alongside crop-level data, or data from a climate control system. And, as with all other data in the 30MHz platform, users can share, compare and collaborate with colleagues.
Learn more

Work more efficiently in groups

Groups are a new way to work together on specific projects monitoring and responding to crops’ needs. Invite team members within and outside your organisation, set permissions and choose the sensors you work with in this interactive workspace.

Why collaboration matters

Gauge your sensor values

Meet gauges. An easy way to see your metrics relative to maximums and minimums. Choose your sensor, choose your metric, select a time period, set your max and mins, and get monitoring.
Read more

Visualise notifications in charts

So you’ve set your dynamic range notifications, now what? Map notification perimeters to your charts, so you can see when your crop levels have gone out of bounds.

Here's how it works

A modern, powerful API

From data from climate control systems, to insights on root zone, irrigation or traceability, view granular crop-level measurements alongside the agri-data relevant to you.
More on our API

Image upload

Make sensor measurements tangible by plotting sensor values onto your choice of images. Visualize sensor readings on maps, diagrams, or photographs.
More about the image upload feature

Calculations

Get more out of your sensor measurements with calculations that deliver new metrics. Use the 30MHz data platform to calculate dew point, vapor pressure deficit, temperature hours, combined utilization and more.
More about calculations in the 30MHz data platform

Share sensor insights

Selectively share sensory data with third parties. Dashboard social sharing lets individuals outside your organization (like partners, customers or advisors) observe changing conditions in your environment in real-time.
More about sharing widgets

Heatmaps

Value heat maps generate live-animated, color-coded visualizations of the state of your crops, with a useful bird's eye view of changes.
More on 30MHz data platform heatmaps

Charts

Track single sensor measurement values or compare metrics with easily customizable graphs and visualizations. Drill down by time frame, location and measurement frequency, and compare locations on a global scale.

Zoom in on your data

Simply click into your chart, click on the starting point you want to zoom into, hold down your mouse, and drag to your desired end point. Let go, and you'll be forwarded to the zoomed view of your data.
It's that simple

Export data

Data is a valuable asset, and we make sure you have full control over who accesses it. Customers are sole proprietors of their sensor data, and can easily download it in CSV.
More on 30MHz data platform data export

Compare locations

Track environments across the globe in a single dashboard. Create custom reports and visualizations based on location, or set one space as a benchmark for comparison.
Across the globe

Customise your branding

Upload logos, change colours, adjust the look and feel of your dashboards and groups and create pre-set themes for yourself, your team members or your customers.
Brand your data
Any questions about the 30MHz platform
Want to know more about our platform, sensors, or connectivity? Ask us anything, we're here to help.

Sign up for our monthly news letter

Get news and updates directly in your mailbox.