New apps and features: 30MHz keeps building on digital horticulture in 2021
This year has learned that it is a huge benefit to be able to share your data. Asking your consultants or colleagues questions and sharing insights from a distance during a global pandemic is easy to do on the 30MHz platform. We saw a huge rise in questions and comments about crops and data during the pandemic. In 2021 we continue to connect people, plants and technology. We are working on some helpful new features for horticulture in 2021. Let’s have a look on our roadmap for the coming year!
Subscribe to our newsletter to read more about digital horticulture
From organisation based to location based
At 30MHz we provide all the elements horticultural businesses in 2021 need to digitise their locations, centralise their data collection and digitally monitor their crops without technical expertise. It’s our ambition to become 100% compatible with every sensor and data source available in the market. This way you can collect and analyse all your data in one place: the 30MHz platform.
To improve your organisation’s overview, it will be possible to split your organisation into different locations. Just like in the physical world. This enables you to create a digital version of your company in a more detailed way. And if your organisation is expanding, your digital environment will grow along.

Split your organisation into different locations.
How can a grower get a clear view of what’s happening in the greenhouse as quickly as possible? That is a key question in our product development. By adding schematic maps to the platform we make data easier to understand. If you have different locations it will be possible to make an accurate digital representation of your organisation, as seen below.

Make zones in your digital greenhouse.
We are also making improvements on the navigation. It will become easier to switch between groups and organisations.

Navigate smoothly between groups.
Apps and plugins for specific needs
Sharing data, asking questions and providing comments on specific cases. Like we said we saw a rapid increase in the social elements of the 30MHz platform. We believe it’s important that you can share information in a simple manner. Especially during times of pandemic. We want you to be able to make the most of consultants’ expertise and advice. In 2021 we want to improve the way you interact with your partners and we will introduce extra features for sharing information.
Our customers asked for specific applications that can be integrated within our platform. We develop these apps with third parties. In 2020 we added Climate Profile by Delphy and 2Grow Plant Insights will follow in January. In the coming months more applications will follow. A sneak peek of work in progress:

Use third party apps to gain more insights.
To illustrate what this means to you as a user we take a look at the new 2Grow app. 2Grow offers sensors that collect data about the sap flow and stam diameter of plants. The Plant Insights application can provide growers with detailed information on the various ways their plant is being influenced. See the image below for an impression of the app.

2Grow Plant Insights shows you what is going on inside your plant.
More insights about light and temperature
We would love to show you another feature that you have been asking for: the scatter plot. This is a type of data visualisation that shows the relationship between different variables. A scatter plot can be very helpful when you can control one continuous variable and the other variable depends on the variation of the first variable. This enables you to see a relation between variables that you don’t see when you just look at the numbers. We show you an example of a scatter plot that uses light as a controllable variable and temperature as a dependent variable. But there are many more variables that you can use in this widget.

Use the scatterplot to translate data into information.
Any ideas for 2021?
2021 promises to be yet another important year in the digitalization of agriculture. Together with you, we want to build an even better platform. A place that suits all your needs. At 30MHz, we are always open to suggestions. We would love to hear from you if you have any ideas or questions. Is there a specific problem that you want to tackle by using data? Do you want to gain insights based on data but you don’t know how to begin? Don’t hesitate and let us know. We will listen and help you.
Feel free to email us: support@30mhz.com.
Three platform features that can be beneficial during winter time
As a grower you want to keep up with all the factors that can influence the climate in your greenhouse. There are multiple features within the 30MHz platform that can help you visualize valuable information during the winter. We’ve listed three features that can help you in the colder months.
Weather forecast
The days are getting darker and temperatures fall. Of course the weather is a key factor in your greenhouse and you want to know precisely which temperatures you can expect. That’s why we’ve built a weather forecast on our platform, so you can get detailed predictions on the expected rain in millimeters, the wind speed, global radiation and many more factors.
The weather data can be specific for a certain location. This is based on coordinates that you provided as a user of the 30MHz platform. You can add a virtual weather station for every location in your network.
It’s also possible to check weather data of periods in the past. The data can be traced back to the moment that your virtual weather station was created.
If you would like to monitor certain weather circumstances with extra caution, it’s advisable use an alarm. An example: if you’d like to know when the temperature drops below the freezing point, you instantly can get a text message or an email via the platform. This way you can act fast and with more accuracy.
Read about how to view weather data in your dashboard.

An example of weather data in our platform.
PAR
For some companies it’s important to keep track of how much light the crops are getting during the darker months. Sometimes it’s necessary to put in some extra hours of artificial light. How do you monitor this data?
Of course you need a PAR sensor. This device monitors the strength of natural light and can be used to measure PPFD (Photosynthetic Photon Flux Density) in agricultural environments. In the 30MHz platform you can visualize the data collected by this sensor.
There is a wide variety of measure units that can be used. It’s not always clear which metric should be used to get the right visualization of your data. No worries, we will help you out. In this article we explain how to apply the right PAR metrics.
Cultivation specialist Leo van Uffelen uses PAR data on a daily basis and made some nice visualizations in his dashboards: “It is important to have a weekly dashboard that visualizes the data per day, as a day can never be the same. This can be visualized with a bar chart. If the weather is changing and for example the light intensity decreases, you can decide to change your screening strategy.”
Van Uffelen wrote down his insights and shows his PAR dashboards in this article.
Chill units
As the name suggests, the Chill Unit widget can be very useful in winter time. Chill Units (CU) are generally used for fruit bearing trees and flower bulbs. Fruit-bearing trees need a period of cold weather after which a fruit-bearing tree will blossom in spring. Flower bulbs need a certain period of cold to sprout or bloom as well.
So to use of the CU widget is ideal for companies that grow fruit or flower bulbs. You can see the feature as an option in the Growing Degrees & Chill Hours application.
CU represents the time of exposure to cold temperatures. To calculate the CU you need to insert a threshold value. For example: if you set the threshold on 10 °C, the feature adds up all the hours below the threshold. Did the fruit trees spend enough time in the cold temperatures? Then you will receive a notification and you know exactly when the flowers are ready to sprout.
Andreas Lypas works as a cultivation manager at Castleton Fruit and he keeps track of the CU while growing strawberries and raspberries. He says the CU widget is a complement to his work: “With no extra effort, all the data appears in my dashboard. With these data, I can precisely analyse next year’s crop of soft fruits and stay focused on other job tasks. I can still evaluate the data and have a global perception of winter temperatures.”
How to use the widget?
For users of our service model it’s easy to set up the widget. In this article we explain step by step how to use this feature.
Need some extra information? In this video our product owner Mirjam Bekker tells you all about the widget en how you can use it:
Using crop level data to optimise IPM strategy
Ant Surrage works as a Technical Development Specialist for Fargro. In this article he explains how collecting and visualising crop level and crop walk data can be helpful with the optimisation of an IPM program.
Integrated pest management (IPM) is now becoming a mainstay of crop protection. However, although our pest management practices are integrated rarely are our datasets. I regularly see growers have several different spreadsheets collecting and storing metrics. To truly unlock the potential of that data it needs to be centralised on a platform and visualised in a way that creates new actionable insights to optimise IPM performance.
There is great value to collecting many different data sets but the two most important from my experience with growers has been microclimate crop level data and detailed crop walk data.

IPM expert Ant Surrage.
The crop level data gives us a more valid metric to base decisions on. The environment within the canopy or on the underside of the leaf can be profoundly different from the surrounding growing environment. This is also measuring and monitoring the areas where pest and disease will develop. This intern means that any decision support dashboards created will be more representative of the crop and lead to better decision making.
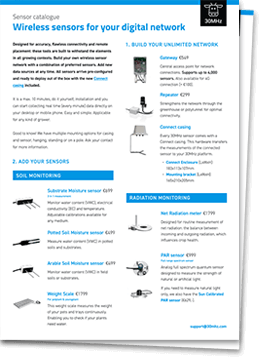
30MHz Sensor Catalogue
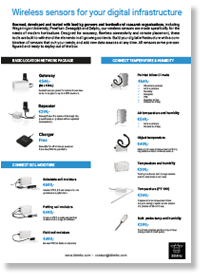 Designed for accuracy, flawless connectivity and remote placement, these tools are built to withstand the elements in all growing contexts. Build your digital infrastructure with a combination of sensors that suit your needs, and add new data sources at any time. Our wireless sensors are made specifically for the needs of modern horticulture.
All sensors arrive pre-configured and ready to deploy out of the box.
Download the 30MHz Sensor Catalogue
How to score pest and disease pressure
Secondly, crop walk data is hugely important as it gives a historic perspective that allows for further refinement and specification of an IPM programme. It is useful for the team crop walking to have an agreed protocol and a mutual understanding of how to score pest and disease pressure. We often see growers score on a scale of 0 – 5, where 0 is no presence and 5 is a severe infection. Ensuring that everyone is scoring a 3 is crucial to make sure data sets are reliable.
Using 30MHz’s data platform and the manual data input function allows us to overlay, in widgets, pest and disease pressure against key environmental metrics such as temperature and humidity. Working with grower groups over the last two years we have been collecting the data and looking for patterns in conditions that may explain the pest and disease increases. Using these widgets and Growing Degree Hours/Growing Degree Days functions we have been able to support growers in improving the timing of their applications of biocontrol and biopesticides.
Understanding and visualising high-risk conditions for disease development has meant that growers have been able to adjust their cultural practices such as spacing, screening and venting. This reduces the risk of disease and can push infection back, which can save on applications of controls measures, saving money but perhaps as importantly in the current approval climate maintain the number of applications for key chemical controls.

Ant Surrage shows his dashboard.
Data can be visualised via the widgets in the platform to recommend in real-time what IPM control measures will work most effectively. The best example of this is biopesticides. Biopesticides tend to be based on living organisms and as such have adapted to inhabit certain environmental conditions. Environmental data can be presented in a way that lets a grower know if the temperatures and/or humidity are correct for an efficacious application. Taking this into account growers and advisors alike can have confidence that the environmental conditions will not be a limiting factor in the efficacy of that IPM input.
To summarise, collecting, centralising and visualising crop level environmental and crop walk data can allow for the optimisation of an IPM programme at every level from cultural and hygiene measures to the application of biopesticides.
Monitor crop-level and climate insights in one platform
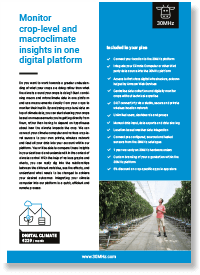 Do you want to work towards a greater understanding of what your crops are doing rather than what the climate around your crops is doing?
30MHz Digital Complete combines macro and micro climate data and uses measurements directly from your crops to monitor their health. We can connect your climate computer and various crop-level sensors to your private wireless network and feed all your data into your account within our platform.
Download the information about Digital Complete
Break the state of winter recess with the Chill Unit widget
Chill Units (CU) are generally used for fruit trees and flower bulbs. Fruit-bearing trees need a period of cold weather after which a fruit-bearing tree will blossom. Andreas Lypas, propagation manager at Castleton Fruit, explains how he uses chilling units to prepare for winter.
Chilling requirement is the number of effective chilling hours needed to restore bud growth potential in spring. Chilling refers to the requirement of low temperature to allow normal growth in the following spring. Not getting enough winter chilling results in a decline in both yield and fruit quality.
The chilling requirement is usually measured in terms of numbers of hours, during which temperature remains at or below 7°C during the colder months of the year. Getting enough winter chill makes sure that latent buds can break the state of winter recess and begin growing during the spring. Measuring chill units can make a huge difference in yield quality of blueberries, strawberries, raspberries, cherries and peaches.
You can use the Utah model to measure the chilling requirement. This model contains a weight function assigning different chilling efficiencies to different temperature ranges. It also weights negative contributions by high temperatures. The Utah model defines a chill unit as the permanence of the buds for a period of 1 hour in a temperature range considered optimum (2.5-12.5°C) to accumulate chill.
The Utah model is more complex because it introduces the concept of relative chilling effectiveness and negative chilling accumulation or chilling negation. According to research temperatures between 0°C and 16°C promote the breaking of rest whereas higher temperatures negate such effects.
Maximum promotion occurs at 7°C ( 1 hour at 7°C = 1 chill unit). Higher and lower temperatures within the range of 0 – 16°C are less effective.

The Utah Model can be used to measure the chilling requirement.
Unfortunately, that means that growers need to keep an Excel file and update it every day. That needs a lot of effort and labour time and cost. Luckily, I found the Growing Degree Units & Chill Hours widget in 30MHz’s platform.
I’m finding the widget extremely useful and I can still see the process in real time. With no extra effort, all the data appears in my dashboard. With these data, I can precisely analyse next year’s crop of soft fruits and stay focused on other job tasks. I can still evaluate the data and have a global perception of winter temperatures. After evaluating the low winter temperatures, I chose to grow the best suitable cherry variety. With a complete picture of the Growing Degree Hours, I achieved precision farming and optimised crop yields.

How Andreas Lypas is measuring Chill Hours in the 30MHz-platform.
What’s very helpful about 30MHz’s sensors and platform, is the accuracy of the data, the transport and the immediate traceability. The calculation of chill hours in the dashboard is done by counting the hours below a certain threshold, which the grower selects and has a graphic representation of evolution.
Helpful and insightful papers:
How a flower grower uses data to improve the cultivation process
Using sensors to measure the temperature of the leaf or check if you marked the dew point right. Growers can use 30MHz technology to improve their cultivation process at a high precision level. Nico Plasmeijer, Cultivation Specialist at BB Plant in Bleiswijk, uses the data platform on a daily basis and explains how he utilises data to improve his cultivation process.
High turnover rate
At nursery BB Plant, they are growing Calla’s all year long. The plant is also known under it’s name Zantedeschia. “Together with the owner Bram Breugem, I’m responsible for the cultivation”, tells Plasmeijer. “This is a small company, so you need to know a a little bit about everything. That makes the job more challenging and exciting. What appeals to me as a grower is that our product is finished in three months. I see this high turnover rate as an advantage. If you have a good product, then the greenhouse looks good for three months. If the quality is somehow a bit off, it will only last a few months. Fortunately, it generally goes well.”
Collecting data

Plasmeijer shows the colorful calla’s in his greenhouse.
Finetuning the cultivation process
After using the data platform for a year, he has really noticed the added value it brings in finetuning the cultivation process. “Whether the plant is doing well or not, we can turn our precise and real-time data into actionable insights. We cannot do that with our climate computer. With the platform, I can make beautiful graphs and charts. It takes a bit of practice, but it does pay off. The layout is nice and clear. I don’t have to visit the greenhouse as frequently anymore, I can easily check how things are going from the comfort of my home.”
‘We thought we tackeled the dew point’
Plasmeijer says the dew point is a good example in which the platform of 30MHz helped him. The dew point is a huge factor in BB Plants greenhouse, because it is important in the prevention of mold. “After we water the plant, we use a strategy for aeration and heating. You have to dry the garden a certain way to prevent the plants from getting too wet. In 30MHz’s platform, we can see the exact dew point. We always thought we had ‘tackled’ the issue of the dew point, but the data showed us that we were staying too close to that dew point for too long.”
The measuring of the leaf temperature is another big advantage according to Plasmeijer. “First we just saw the temperature of the greenhouse, but now we can see exactly what the temperatures of the plants are. That’s what I mean with finetuning. First you collect data and then you act accordingly.”
 30MHz Sensor Catalogue
Designed for accuracy, flawless connectivity and remote placement, these tools are built to withstand the elements in all growing contexts. Build your digital infrastructure with a combination of sensors that suit your needs, and add new data sources at any time.
Measuring underneath the plastic
Plasmeijer likes to experiment with sensors to obtain more data on a precision level. Another example: “After we water the Calla’s, we cover the plants with plastic. We never knew exactly what was happening underneath the plastic. Now we have placed a sensor under the plastic that tells us how we can best heat up the greenhouse to create the perfect conditions under the plastic. We are very happy with this data. But only collecting data is not the answer. You have to know how to translate it into actionable insights and learn how to work with it. That’s what we are doing now.”
5 best practices voor digitale tuinbouw in 2020
In het afgelopen decennium heeft de wereld een behoorlijke digitale transformatie doorgemaakt. En deze trend zet stevig door met de toenemende innovaties in alle sectoren, waaronder de tuinbouwsector. We geloven echter dat er op het gebied van digitale tuinbouw nog veel onbenutte mogelijkheden zijn. Wat is digital tuinbouw en waar begin je? We hebben 5 best practices voor je op een rij gezet voor 2020.
1. Meet en vergelijk verschillende variabelen voor meer controle

Door meerdere databronnen te gebruiken en variabelen te meten, kan er een vollediger en nauwkeuriger beeld geschetst worden van het klimaat in een kas of tunnel en van de gezondheid van het gewas. Om de switch te kunnen maken van een reactieve en risicogedreven aanpak naar een meer proactieve en winstgedreven aanpak, dienen alle besturingsapparaten en databronnen met elkaar te communiceren en samen te werken. Dat is het doel van ons dataplatform.
Angela Zwinkels van Zwinkels Agro B.V., een auberginekwekerij, legt uit: “Met behulp van de klimaatcomputer en 30MHz sensoren meten wij de temperatuur in de kas, luchtvochtigheid, CO2, zonnestraling en planttemperatuur. Al deze informatie verzamelen we in het dataplatform van 30MHz. Een groot voordeel hiervan is dat we gemakkelijk alle data kunnen analyseren en vergelijken, alsook de relaties tussen de verschillende variabelen. Zo leggen we bijvoorbeeld de planttemperatuur naast de kastemperatuur, om te voorkomen dat er condensatie ontstaat wat schimmel op het gewas kan veroorzaken. Vooral later in het seizoen wordt dit steeds belangrijker. Verder meten we bijvoorbeeld ook het effect van zonnestraling op de planttemperatuur.”
“Wanneer we merken dat er ongunstige situaties ontstaan in het gewas of in de data, kunnen we hier direct op anticiperen en weten we ook precies wat er moet gebeuren. Het is dankzij het 30MHz platform en de sensoren heel makkelijk om te traceren en uiteindelijk te voorspellen wanneer, waar en waarom bepaalde situaties zich in het gewas voordoen. We kunnen de klimaatomstandigheden en settings altijd precies nagaan en bijhouden,” zegt Angela.
Nog een mooi voorbeeld is paprikateler Gubbels. Zij hebben met behulp van 30MHz technologie hun productie met 2,5% weten te verhogen. Na een jaar was de ROI 256,4% en na 3 jaar 813.5%. “Sinds we beter kunnen monitoren zien we veel minder gebroeide paprika’s. Door de data te analyseren in het 30MHz platform, weet ik dat ik de ramen langer dicht kan houden. Op deze manier blijft er meer luchtvochtigheid en CO2 in de kas, zonder dat de temperatuur te hoog wordt,” zegt Geert Colbers, teeltmanager at Gubbels. “Dankzij de Pointed Microclimate Sensor is het aantal gebroeide paprika’s gedaald en daarnaast is de productie gestegen sinds we de schermen langer open kunnen houden. Voordat ik met het 30MHz platform en de sensoren werkte wilde ik altijd op veilig spelen, met de werkwijzen die ik gewend was. Nu heb ik veel meer zelfvertrouwen en durf ik meer te experimenteren, bijvoorbeeld door meer zonlicht binnen te laten en zo optimaal te profiteren van de zon.”
Het platform en sensortechnologieen zijn ook populair onder researchers. Onze partner Delphy gebruikt 30MHz software en hardware in hun testcentrum voor aardbeienteelt. Hier werken ze aan manieren om de optimale temperatuur te creëren en energie te besparen via schermen. Ze gebruiken de Pointed Microclimate sensor om de vruchttemperatuur te monitoren. Iedere week combineren en vergelijken ze deze data met andere klimaatdata, zoals van de klimaatcomputer, om een uitgebreide analyse uit te kunnen voeren. Tristan Balk, Researcher Improvement Centre bij Delphy, zegt: “Het 30MHz platform is erg gebruiksvriendelijk en biedt veel vrijheid en mogelijkheden om met verschillende widgets gepersonaliseerde dashboards te creëren, die de juiste inzichten om onze tests te kunnen uitvoeren.”
Net zoals bij het telen van groenten en fruit, kent ook de bloementeelt veel variabelen. Dümmen Orange weet inmiddels de voordelen van het meten van deze verschillende variabelen. Ze meten licht, temperatuur, luchtvochtigheid, luchtdruk, EC en potvocht om de planten zo gezond mogelijk te laten groeien, ze zoveel mogelijk in een vegetatieve staat te houden en bloei uit te stellen.
>> Download de 30MHz Sensor Catalogus
2. Combineer data van de klimaatcomputer en sensoren in één platform

Data-gedreven tuinbouw wordt steeds belangrijker. Door gewassen in realtime te monitoren kunnen teeltstrategieën geoptimaliseerd worden. Daarom heeft BASF besloten hun Priva klimaatcomputer te integreren met het dataplatform van 30MHz, in combinatie met een reeks draadloze sensoren. Rob Wouters, teeltspecialist bij BASF, zegt: “Deze opzet geeft ons betere inzichten in de teeltprocessen. Binnen het platform kunnen we al onze teeltdata inzichtelijk maken en visualiseren in gepersonaliseerde dashboards. We kunnen de verschillende metingen gemakkelijk monitoren en een nauwkeurig beeld schetsen van het klimaat in de kas.”
BASF heeft ondervonden dat deze werkwijze niet alleen gunstig is voor de productiviteit, efficiëntie en resource management, het helpt ook bij het opleiden van nieuwe medewerkers. “Een van onze uitdagingen is het waarborgen van de continuïteit van de opgedane kennis en kennisoverdracht aan nieuwe collega’s,” zegt Rob. “Zelfs voor ervaren professionals kan het proces van interne training jaren duren. Met de technologie van 30MHz en de Priva integratie kunnen we gemakkelijker en sneller onze teeltmethoden uitleggen en onze kennis overdragen aan nieuwe collega’s.”
Ook paprikateler Jacco van den Ende heeft zijn klimaatcomputer gekoppeld aan het dataplatform van 30MHz, waarin hij klimaatgegevens combineert met data op gewasniveau. Jacco: “Ik kan nu gemakkelijk data combineren en vergelijken en verschillende grafieken over elkaar heen leggen. Zo kunnen we bijvoorbeeld veel sneller veranderingen in de temperatuur spotten, waardoor we ook sneller kunnen handelen. Voorheen gebruikte ik twee schermen en schoof ik met mijn stoel van het ene naar het andere bureau. Nu heb ik maar één scherm en dashboard nodig en dit kan ook mijn telefoon of tablet zijn. Dat maakt het allemaal een stuk simpeler. Ik gebruik het platform ook om samen te werken met mijn adviseur. We analyseren de data en bepalen naar aanleiding daarvan de ideale klimaatinstellingen. Ook helpt het ons manieren te vinden om de productiviteit te verhogen.”
Madestein UK is ook blij met de integratie tussen hun Priva klimaatcomputer en het 30MHz platform. Directeur Jonathan Zwinkels zegt: “De integratie verliep heel soepel en er was weinig inspanning vanuit onze kant nodig. Het was snel, efficiënt en remote. Het samenbrengen van al onze databronnen levert ons vele voordelen op. Het stelt ons beter in staat om data te vergelijken en tracken, bijvoorbeeld de VPD van een blaadje basilicum of stresspunten op sla. We kunnen de VPD data inzichtelijk maken in grafieken en de verbanden leggen tussen deze data en de klimaatbeheersing en ventilatiestand. Hierdoor kunnen we veel proactiever toewerken naar de gewenste resultaten.”
3. Gebruik data om gewassen te beschermen tegen plagen en ziekten

De kwaliteit van data is cruciaal bij geïntegreerde bestrijding van ziekten en plagen (IPM), volgens Ant Surrage, Technical Development Specialist bij Fargro. Hij schreef er vorig jaar over in een artikel van The Grower, een Engels tijdschrift van de Agriculture and Horticulture Development Board (AHDB). “Telers moeten erkennen dat hun omgeving waarschijnlijk niet uniform is. Binnen hotspots, gebieden met een hoge luchtvochtigheid en gebieden met vocht, ontstaan snel plagen en ziekten. Als monitoring- en preventieve programma’s hier volledig op ingericht worden, zal dat grote voordelige gevolgen hebben voor het IPM-programma, ”zegt Surrage hierover.
Telers combineren verschillende klimaat- en gewasinzichten (zoals dauwpunt, dampdruktekort / VPD, absolute vochtigheid / AH, vochtigheidstekort en het absolute verschil tussen luchttemperatuur en dauwpunt) in het 30MHz-dataplatform. Dit geeft hen de mogelijkheid om insecten, schimmels en ziekten die de ontwikkeling van gewassen in gevaar kunnen brengen te bestrijden. Ant vervolgt: “Om dit optimaal aan te pakken, kunnen telers nog een stap verder gaan door het microklimaat te begrijpen en te controleren. Het microklimaat is de omgeving rond een plant. Deze is vaak aanzienlijk anders dan hoe de omgeving aanvoelt wanneer je door een kas loopt. Het is noodzakelijk om daar rekening mee te houden.”
Maar wat gebeurt er als er een virus uitbreekt? Virussen verspreiden zich over het algemeen gemakkelijk en snel door gewasbehandeling, snijden en insectenbestuiving. Preventie vereist daarom strikte en proactieve maatregelen. Het identificeren van virussen kan lastig zijn. Het zou daarom een enorme vooruitgang zijn als het voorkomen van verdere uitbraken digitaal kan verlopen. Je kunt hierbij denken aan het vergelijken van afbeeldingen, waarbij teeltmedewerkers op een centrale digitale plek met elkaar tot een plan van aanpak komen, zonder dat er onnodige bezoeken ter plaatse nodig zijn.
4. Datagestuurde teeltprocessen

“In de tuinbouw telen de meeste telers hun gewassen op basis van gevoel en intuïtie. We zijn dit ook gewend. Maar nu de hulpmiddelen en sensortechnologieën steeds beter worden, kunnen we meer op data gaan vertrouwen en een datagedreven aanpak hanteren. Ik denk dat het combineren van de intuïtie van telers met de juiste tools, zoals draadloze sensoren, softwareprogramma’s en systeemintegraties, steeds belangrijker zal worden, ”zegt Matthijs Woestenburg, Innovation Manager bij Gitzels Plant Nursery.
Hiermee kunnen telers een database bouwen die vol zit met zinvolle en adequate gegevens die het klimaat en gewas beschrijven. Dit biedt de mogelijkheid om teeltstrategieën en productieprocessen in één digitaal platform te beheren en te optimaliseren. Telers volgen de gewassen in hun kas of polytunnel op de voet en houden een interactief verslag bij van hun teeltmethoden. Daarbij wordt gekeken naar onder andere het klimaat, bodemvocht, energieverbruik, CO2 en gewasgezondheid op elk moment en op elke plaats. De beslissingen die vervolgens genomen worden hebben betrekking op bijvoorbeeld de strategieën voor klimaat-, irrigatie- en plaagbeheer. Uiteindelijk leidt dit tot hogere productiviteit, efficiënter gebruik van grondstoffen en een hogere gewaskwaliteit.
Matthijs: “We besloten dat we de volgende stap wilden zetten in het digitaliseren van onze productieprocessen met 30MHz. Behalve het platform zijn we ook microklimaatsensoren gaan gebruiken, om die gegevens te vergelijken met onze bestaande klimaatcomputergegevens. Dit heeft ons veel nieuwe, interessante inzichten opgeleverd. We gebruiken ook de Sendot-zuurstofsensor, waarmee we eenvoudig zuurstof in de pot en direct in de vaten kunnen meten. Al deze gegevens worden ingevoerd in het dataplatform van 30MHz, zodat we die inzichten op elk moment van de dag kunnen analyseren en gebruiken. We hanteren nu een droger klimaat in de kas, waardoor we valse meeldauw kunnen voorkomen. Door zuurstofniveaus en temperaturen op gewasniveau te meten, wordt het een stuk eenvoudiger om het klimaat voor de planten te optimaliseren. Als het klimaat optimaal is, is de plant gezond en wordt hij niet ziek. Het 30MHz-platform biedt het voordeel dat alle gegevens op één plek worden verzameld en toegankelijk worden gemaakt via meerdere apparaten, waaronder mijn telefoon.”
5. Consistente teeltprocessen op meerdere locaties door online samenwerking

Om de tuinbouwsector goed te kunnen bedienen, moet een dataplatform het vergelijken van locaties eenvoudig maken – of die locaties nou vlakbij, ergens anders in het land of waar dan ook ter wereld zijn.
Het 30MHz-dataplatform is gebouwd met het oog op samenwerking. Dat houdt in dat het makkelijk is om verschillende databronnen (sensorgegevens, klimaatregeling, handmatig ingevoerde data) met collega’s online te bespreken en te verkennen. De mogelijkheid om op afstand samen te werken met realtime en historische teeltgegevens is een belangrijke stimulans voor tuinbouwbedrijven die streven naar meer consistentie op meerdere locaties, het optimaal benutten van de expertise van consultants en het benutten van kennis binnen gedecentraliseerde teams.
Piñata Farms in Australië gebruikt met succes deze functies van ons dataplatform. Ze wisselen op die manier informatie uit met het in Groot-Brittannië gevestigde Berry World. Er zijn momenteel vijf telers die het platform gebruiken, waaronder technisch manager Lee Peterson: “We hebben groepen aangemaakt waarin zowel telers van ons als van BerryWorld zitten, zodat we via het 30MHz dataplatform dashboards kunnen delen. We vergelijken de resultaten van verschillende bessenrassen op verschillende locaties. We laten bijvoorbeeld opmerkingen achter en stellen vragen in het dashboard, waardoor de uitwisseling van informatie steeds meer gestroomlijnd verloopt.”
Dutch horticulture gets big compliment from David Attenborough
David Attenborough’s new film ‘A Life On Our Planet’ (that feels like his final tribute) just released on Netflix. In his film, he gives a big compliment to the Netherlands and the Dutch horticulture sector in particular. “Dutch farmers have become experts in getting the most out of every hectare. Increasingly, they’re doing so sustainably,” he says. “It’s entirely possible for us to apply both low-tech and high-tech solutions to produce much more food from much less land. As we improve our approach to farming, we’ll start to reverse the land grab that we’ve been pursuing ever since we began to farm.” View a clip of the documentary below or, better yet, watch the full movie here.
Our little country is a frontrunner when it comes to horticultural innovations and we’ve made significant steps towards a more sustainable food production system. Largely thanks to our increasing technology-based approach towards food production, using a combination of engineering, plant science and computer-managed technologies to optimise production efficiency.
With this knowledge, we can contribute to much-needed collective solutions to global environmental challenges. So, let’s continue to innovate and share our knowledge with the world!
Next steps in digitisation for Delphy
Data platform supplier 30MHz and research and consultancy company Delphy have entered into a partnership. In addition, Delphy uses the data platform as an analysis tool among its consultants and researchers while at the same time co-developing cultivation-related applications. These in turn will be available to all users of the platform in an app store-like environment.
The collaboration ensures that Delphy will digitise more quickly. Consultants are getting more and more opportunities to assist the grower in improving cultivation. For 30MHz it is the next step towards a rollout of the platform within horticulture.
The first application to be hosted on the 30MHz platform is the Delphy Climate Profiler. Within this application, knowledge of Delphy is translated into an application that provides real-time cultivation advice. The application was developed and used during the Autonomous Greenhouse Challenge last spring, and has now been tested at a number of horticulture companies.
Aad van den Berg, manager of Delphy Digital, is pleased with the collaboration. “The collaboration actually started four years ago on a project basis. And it was intensified by the Autonomous Greenhouse Challenge. In it we developed the system to control the climate data-driven. The special thing is that 30MHz is not familiar with horticulture Their knowledge and skills are complementary to what we want to achieve in our digitisation strategy. This enables us to remain independent and reliable. ”
30MHz CEO Sytse Zuidema says he is proud of the collaboration: “We have both invested a lot in the relationship. That has led to trust and ultimately in a contract. Delphy is a huge knowledge company. And they will use increasingly detailed information to determine the cultivation process. As a result, growers can run more production with fewer resources. And what 30MHz adds to this future of growing, is enabling growers to take that process further via a platform.”
About Delphy
With over 240 cultivation experts, Delphy is the knowledge company for entrepreneurs in all plant sectors; if there is a leaf on it, we know about it. Continuously developing knowledge and making it applicable, nationally and internationally is our DNA and is Delphy’s main activity. Our experts contribute to the results of our partners with expert and independent research and advice, based on our own knowledge development. Delphy’s strategy is to continuously develop and apply cultivation knowledge and methods.
In case you have any questions, please send us an email via contact@30mhz.com.
Did you already add these ten horticulture influencers to your feed?
The world has changed completely in recent months. And especially the way in which people communicate with each other. It has been almost completely digitised, and that has a major impact on daily life. Online (social) media are more than ever the place to start a conversation. For example, to catch up on the latest corona measures, celebrate your family’s birthday or just have a coffee chat.
Horticulture is also increasingly finding its way into the digital world. The ecosystem of growers, advisors, distributors and researchers supports each other through tools such as Zoom, WhatsApp and WeChat. Major fairs such as GreenTech are switching from offline to online events and every self-respecting company organises webinars to keep the target group informed of the latest developments. We also see a steady increase on our platform when it comes to discussing and analysing crop data.
We can imagine that in this growing mass of information it is difficult to keep track of which matters are relevant to your company and horticulture itself. Fortunately, there are a lot of interesting people active who filter this information for you and share it with you in a pleasant way. The only question is, who are these people that help you stay updated in this fast-changing world. That’s why we’ve shortlisted ten influencers we believe should appear in your daily feed:
Rob Baan
 The undisputed nestor of horticulture. He was one of the first to ring the alarm when corona threatened the horticultural sector. Koppert Cress himself had almost died in the crisis, but remained afloat with art and flying work. Baan has argued for years that society should live healthier, based on healthy and high-quality fruit and vegetables. The entrepreneur is regularly invited to television programs such as Dream School, is a well-known speaker and is very active on channels such as Twitter and LinkedIn
Ben Bardsley
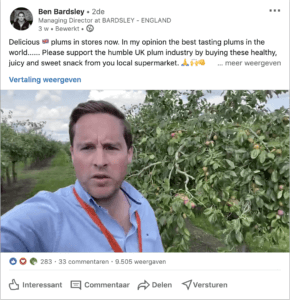 Ben Bardsley is Rob Baan’s British counterpart. As the owner of one of the largest top fruit growers in Great Britain Bardsey – England, Ben regularly comes to the fore to encourage the (English) population to consume fruit and vegetables. Bardsley distinguishes himself with his characteristic vlogs that he records while walking or driving through the orchards.
Jasper den Besten
 Jasper den Besten has been a lecturer at the HAS University of Applied Sciences in Den Bosch for many years and is a well-known face within the sector. Despite the fact that Den Besten himself is not very active on LinkedIn and Twitter, he shares strong insights through a regular column in the magazine and on the Onder Glas website. Earlier this year, for example, he warned against a lag in growth markets such as the Chinese, and the implementation of robot technology.
Chris Higgins
 As the owner of Hort Americas, the American branch of HortiCoop, Chris is the guiding light for growers and growers who use greenhouses or polytunnels. Higgins keeps a close eye on all innovations and makes direct connections with concrete projects where possible. He has experience with LED lighting, knows everything about different substrate types and is paving the way for AI-controlled cultivation.
Cindy van Rijswick en Arne Bac


Van Rijswick and Bac work at Rabobank as respectively Expert Fresh Produce and Sector Specialists. Both are very active on LinkedIn and regularly share their findings in the field of vegetable, fruit and flower cultivation. Recently they were a guest in one of the 30MHz webinars entitled “Sustainable rendering in horticulture”.
Hannie Moors-Swinkels
 There is a strong partner behind every horticultural entrepreneur, and that is especially true in the case of pepper nursery Moors. Rob is more than supplemented in the daily management by Hannie Moors-Swinkels. On her accounts she claims to give “color to paprika” by updating the corporate accounts on Facebook, Instagram, Twitter and LinkedIn with interesting content.
Rene Beerkens
 From his position as Horticultural greenhouse consultant at climate computer builder Hoogendoorn, Rene Beerkens has a central role in the Plant Empowerment movement that has established a firm foothold in recent years. Beerkens was also one of the driving forces in the team that won the Autonomous Greenhouse Challenge, team AuTomatoes. Beerkens is very active on LinkedIn and is regularly featured in the press.
Ant Surrage
 Fargro is an agricultural supplier in Great Britain. Ant Surrage is one of its most famous collaborators. He’s a technical development specialist who specializes in Integrated Pest Management or pest and pest control. This relatively young face in horticulture has an infectiously enthusiastic way of explaining to growers and growers the benefit of data at crop level in optimizing your IPM strategy, as you can also see in this webinar.
Wessel van Paassen
 The uncrowned Prince of Horticulture Wessel van Paassen knew what he wanted from a young age: his own company. As the son of a chrysanthemum grower, he knows all about the ins and outs of a greenhouse company. He has a strong opinion about the future of the horticultural sector, which he believes should be data-driven and integrated as much as possible with production-enhancing technology. An opinion that he has been able to express in many interviews in newspapers and on television. In this interview, Wessel explains what his company Green Simplicity contributes to that vision.
Angel Angelov
 Eighteen years ago, Angelov emigrated to Great Britain to grow into a knowledge base for strawberry growers worldwide. He is a Glasshouse Manager at Beeswax Dyson Farming and is currently working on building the most sustainable strawberry greenhouse ever. In addition to being a champion for renewable energy, Angel regularly fills his LinkedIn timeline with beautiful photos of nature and of course greenhouses.
Cultivation variables explained: growing degree units
In this blog, we would like to tell you something about growing degree units (GDH / GDD). The reason we added this to our dashboard is that during a lot of conversations our users often ask for this. Degree hour insights are used to pro-actively control cultivation. Growers however indicate that the calculation is time-consuming because it’s done manually and is only available on their PC on which the calculation is performed.
Growing degree units already is a proven concept. What is new, however, is that you can now view this metric in real-time on the 30MHz platform. Even if you are in the middle of a crop walk. And you can combine this information with the insights of all your other crop level data.
Calculating growing degree hours and days
But what exactly are growing degree units? GGH or GDD are calculated based on temperature and used to predict the development of plants or insects. This way you can estimate when your crop will be in bloom or assess how pests or your IPM is developing. You basically optimise the timing of your crops or biological pest control.
We use a threshold value when calculating degree units. The threshold value is the temperature below which you do not expect  crop development. This threshold value is specific to a crop or pest. For degree hours you use the average temperature of one hour. For degree days you use the average 24-hour temperature. You subtract the threshold from the average temperature for the calculation, if it is 0 or lower you have 0 degree units. If your average hourly temp is 2 degrees above your threshold, you have 2 degree hours, and at 10 degrees above the threshold, you have 10 degree hours. Those degree hours are added together.
Cold nights during spring
You can imagine that this can lead to a difference especially on clear cold nights during spring: if you use the average temperature of a 24-hour period, you may not exceed your threshold value. If you now calculate the average temperature per hour, you will see that you do not reach the threshold at night, but a number of sunny hours in the middle of the day can indeed exceed the threshold.
If you already work with degree days and have experience with this, I advise you to continue with this. If you are going to start using growing degrees now, use degree hours are easier to use and interpret, because this is more accurate.
Pointed Micro Climate sensor
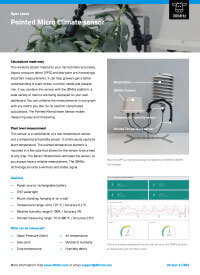
This sensor uses leaf temperature and temperature humidity measurements to continuously capture microclimate at close range. Use data from the sensor to better determine heating needs, cutting unnecessary energy expenditures and lowering the risk of plant fungus and disease.
A lot of our customers use this sensor for measuring VPD and dew point.
Chill units
In the widget you will see that there is also an option for chill units. Here the threshold is not a lower limit, but an upper limit. You add the period below the threshold value here. Chill Units (CU) are generally used for fruit trees and flower bulbs. Fruit-bearing trees need a period of cold weather after which a fruit-bearing tree will blossom (also known as a vernalization requirement), as do flower bulbs need a cold period for sprouting or bloom. Fruit trees need to spend a specific amount of hours below a threshold temperature to break dormancy so they will flower and set fruit normally.

Chill units is the calculation of the period of cold temperature exposure. The calculation of chill hours in our dashboard is done by counting the hours below a certain threshold. [note, GDH counts the hour times the temperature above a threshold, CU counts the hours below a threshold] During the cold temperatures the plant and flower buds are in a dormant state until they have accumulated sufficient chilling units (CU). When enough CU have accumulated, the flower buds are ready to grow in response to high temperatures.
How you set up the widget
If you use the 30MHz dataplatform, it is easy to set up the widget for GDU. To do this, navigate to “add widget” at the top right of the dashboard. You will find the widget at the bottom, after which you have to fill in a number of fields. In the video at the top of this blog, our colleague Mirjam Bekker explains in detail how to do this.
Start digitising your cultivation process
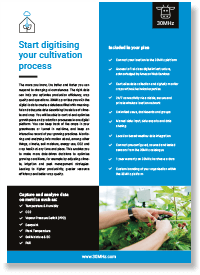 The more you know, the better and faster you can respond to changing circumstances. The right data can help you optimise production efficiency, crop quality and operations.
30MHz Digital Connect provides you with the digital tools to create a database filled with meaningful and adequate data describing the status of climate and crop. You will be able to control and optimise growth plans and production processes in one digital platform.