Monitor EC: New Irrigation Management App feature
By popular request, we have added a new feature to the Irrigation Management App. As of today, you will be able to monitor EC (Electrical Conductivity) levels in your soil or substrate, next to the VWC (Volumetric Water Content) levels.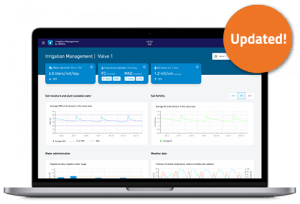
EC measurements in the soil or substrate indicate whether too much or too little fertilizer is being supplied.
Measuring and monitoring EC as well as VWC levels helps to keep the right balance between uptake of water and uptake of nutrients in a plant.
How to measure and monitor EC
Determine your optimal EC range in the soil or substrate based on crop type, production decisions and growing conditions.
For precise measurements, obtain periodic samples from the irrigation water and fertilizer that is supplied to plants, and from the soil or substrate. This will be your EC baseline measurements and reference. You can then compare these EC values with the acceptable range for a given crop to make informed production decisions.
With the Irrigation Management App and Kit, soil or substrate EC is measured to monitor nutrient availability and uptake, and water uptake by the plants on a daily basis. You continuously collect and monitor soil or substrate EC values with the wireless moisture (TEROS12) sensors, to see if EC levels remain stable or show an upward or downward trend. This allows for timely corrections before nutrient deficiencies or high soluble salt issues have undesirable effects on crop growth and development.
What’s new in the app?
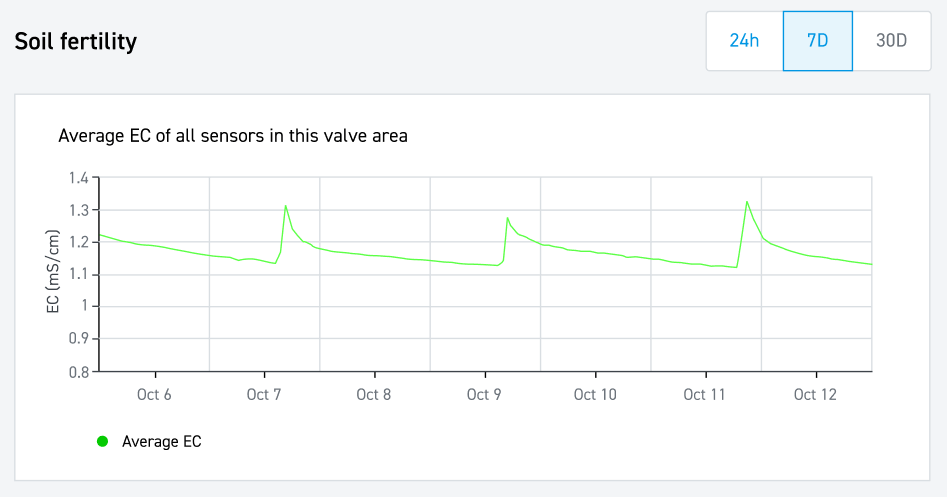
You will see a new ‘soil fertility’ graph in the top right of the app dashboard, next to the ‘soil moisture and plant available water’ graph. The soil fertility graph shows the average EC values of all the sensors in your valve area. This allows you to monitor whether EC levels in your soil or substrate remain stable or show undesirable changes.
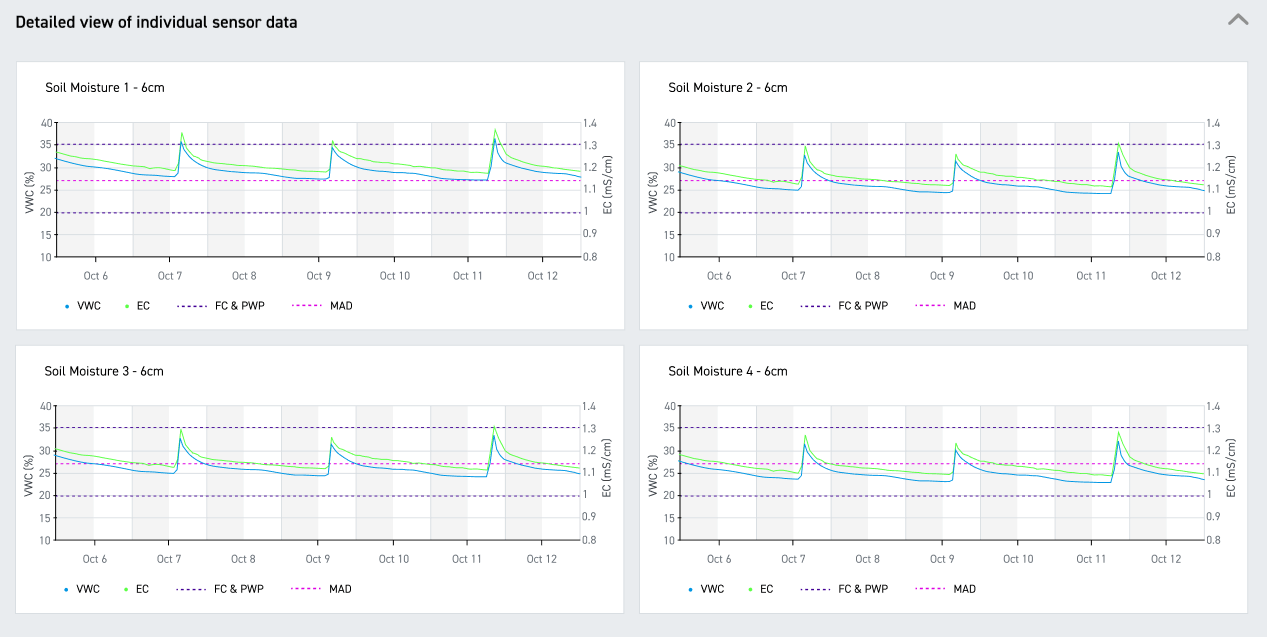
You will see EC lines (green) in the detailed graphs, which show data from each individual sensor in your valve area. This allows you to look into EC levels from a specific sensor spot and quickly spot if anything is out of the ordinary. You can also compare EC and VWC measurements in these graphs.
Irrigation Management Guide
 Optimize your irrigation and fertigation strategy by monitoring and managing soil or substrate moisture levels with the use of Moisture sensors, moisture thresholds, and irrigation alerts.
Gain control over the root zone environment by making measurements, observing trends over time, and using this information to make irrigation and fertigation decisions.


30MHz is typing… Our extended support team is ready to chat!
At 30MHz we think it’s important that our users can use our platform in an optimal way. At times you may have questions and you would like some help from our support team. Email and our support page filled with helpful articles were your go to’s. But we thought it was time for something extra… ...Read more
New 30MHz connect casing: How we protect your tech
To make sure your dataflow is fully protected, 30MHz introduces a new connect casing: waterproof, dust proof and even resistant to hits. This special shield will last longer and ensure a reliable dataflow from the connected sensor. What does that full protection mean? That’s what we will explain in this article. Watertight: resistant to wetness ...Read more
Smart assistant at work
After the launch of the smart (AI) assistant at GreenTech, the first growers have started using this new feature. The assistant helps them gain insights from their data faster and supports daily decision-making in the greenhouse. Growers report that they use the assistant for: Calculating differences in water content throughout the day Quickly identifying trends ...Read more

