What if you could save 40% of the time you spend analyzing data?
Most operations are sitting on a goldmine of information.
Climate logs, substrate readings, irrigation cycles, and performance history. But for many, that data is locked in dashboards.
When you need a specific answer, the workflow is usually:
- Open the platform.
- Select the right sensors.
- Adjust date ranges.
- Manually compare graphs to find a correlation.
The question exists. The data exists. But connecting them takes time – time you’re usually spending in the greenhouse, not behind a screen.
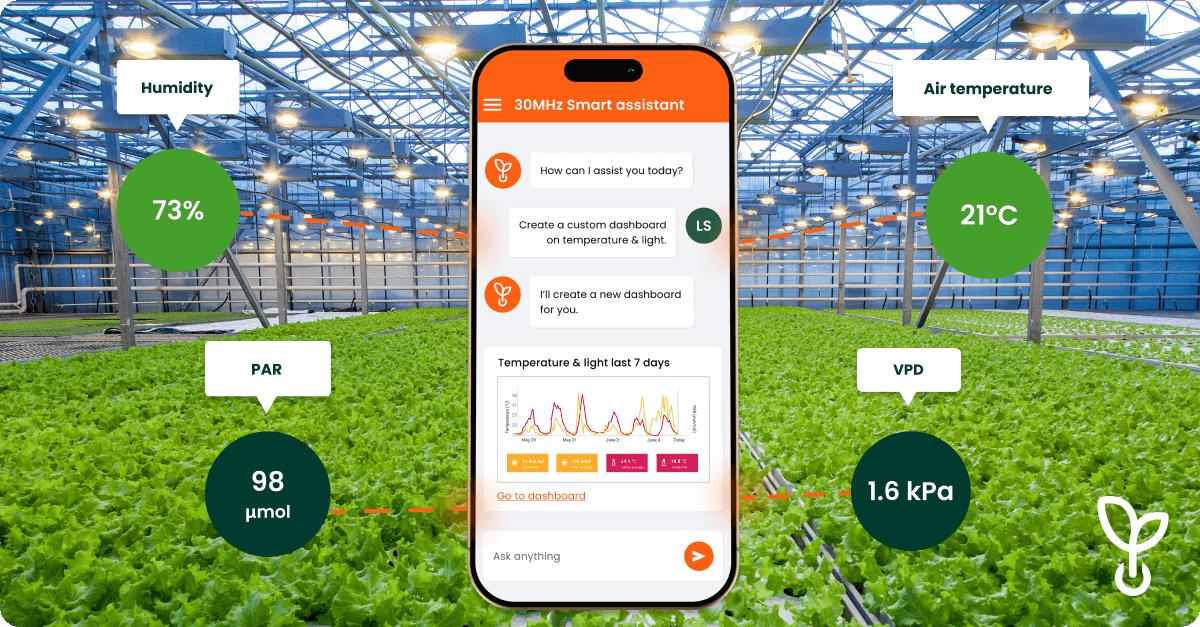
We developed the Smart Assistant to change that.
Instead of building graphs, you just ask. “Calculate differences in water content throughout the day” or “Show me substrate EC trends over the last two weeks.”
The Assistant analyzes your data and creates the visualization automatically.
That 40% time savings means less time hunting for patterns and more time making decisions that matter.
Faster answers mean you’re managing today’s conditions, not yesterday’s problems.
What’s the first question you’d ask your greenhouse data?