Slow summer season?
Not for us! Check out the 5 latest developments we’ve made to help you make even better use of your data.
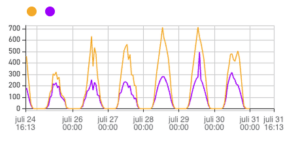
- Spot trends faster with clearer graphs
Quickly get the insights you need. With the new color picker, you can now assign fixed colors for the data in your widgets. Whether you’re monitoring temperature, humidity, or CO2, tailor your color indicators to match your workflow and visual preferences for faster decision-making.
Additionally when you have multiple lines in 1 graph, you can now easily highlight the information you need by moving your mouse over a data point.
- All your data in one place
Your growing environment is complex and so is your data. With 30MHz, you bring together greenhouse, climate, crop, & sensor data from various sources into one smart platform. The result? Better insights = smarter decisions. We can connect data from various partners in horticulture. Want to add your external sensor or system? Reach out to l.vanderlely@30mhz.com to discuss the possibilities.

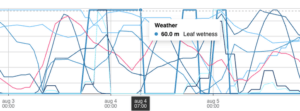
- Leaf wetness monitoring
Leaf wetness is a new parameter of the weather data. It describes if there is dew left on surfaces and is used for detection of fog and dew conditions. This type of measurement is especially valuable for outdoor growers, as it provides early warning signs for disease-prone conditions.
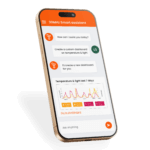
- Smart (AI) assistant
We’re excited to introduce a smart assistant to the platform. This AI-powered feature helps users find insights faster by answering questions, suggesting relevant charts or datasets, and making it easier to navigate large sets of crop data. Whether you’re exploring new patterns or troubleshooting an issue, the assistant is here to support data-driven decision-making.
- Zones for Grouped Monitoring
Okay this one we started before summer, but did you know that you can group your data easily in zones? Create zones tailored to your needs, whether it’s a specific crop section, climate zone or compartment. You can now easily keep track of where data is coming from. We even keep the historic zones for you.
We’re always looking for new ideas to improve, want to think along? Leave your email address and Sharon will get in touch.